

Shipping fast is awesome. You're moving quickly, breaking things (hopefully not too much), and getting value into users' hands fast. But sometimes, you pay the performance tax.
That's what I realized a few days ago.
At Levels.fyi, we've been focused on shipping our new product, Interactive Offers, to early customers over the past few months.
Then came one peaceful Monday. Fresh off a long weekend, coffee in hand, good vibes in the air, I decided to take a step back and fire up the React Profiler to peek under the hood.
And, well…

As Shakespeare might've said:
"Hark, the morn doth break, and thou shalt dedicate this Monday's toil to mend this tangled mess of re-renders."
So let's tackle it one case at a time.
Case 1: Improving Our Employers Dashboard by ~5x
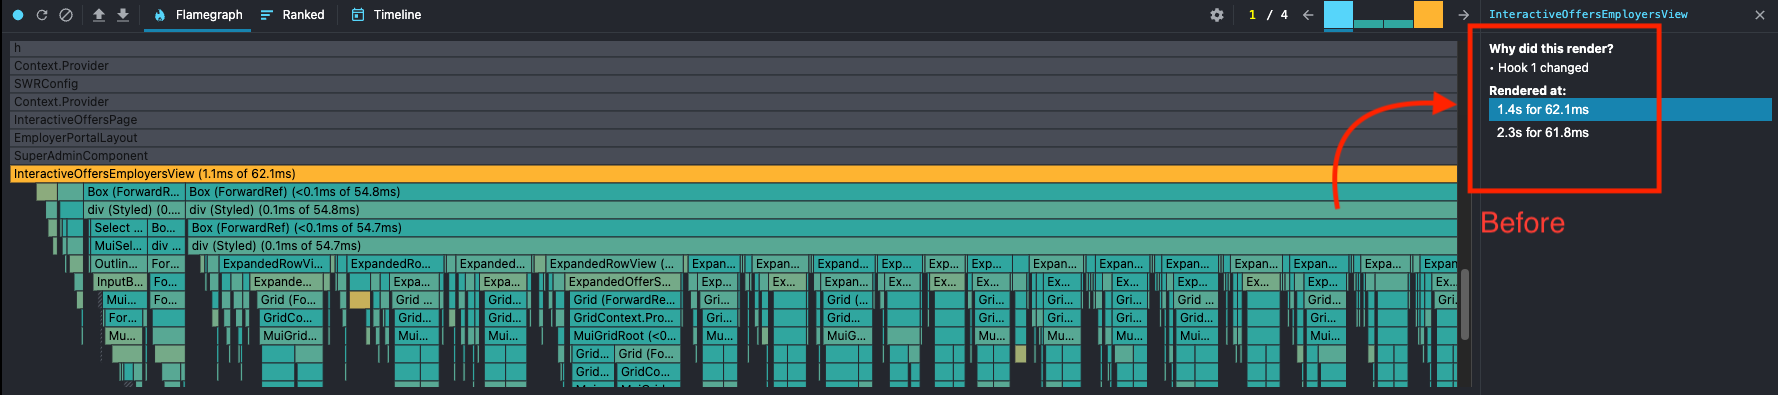
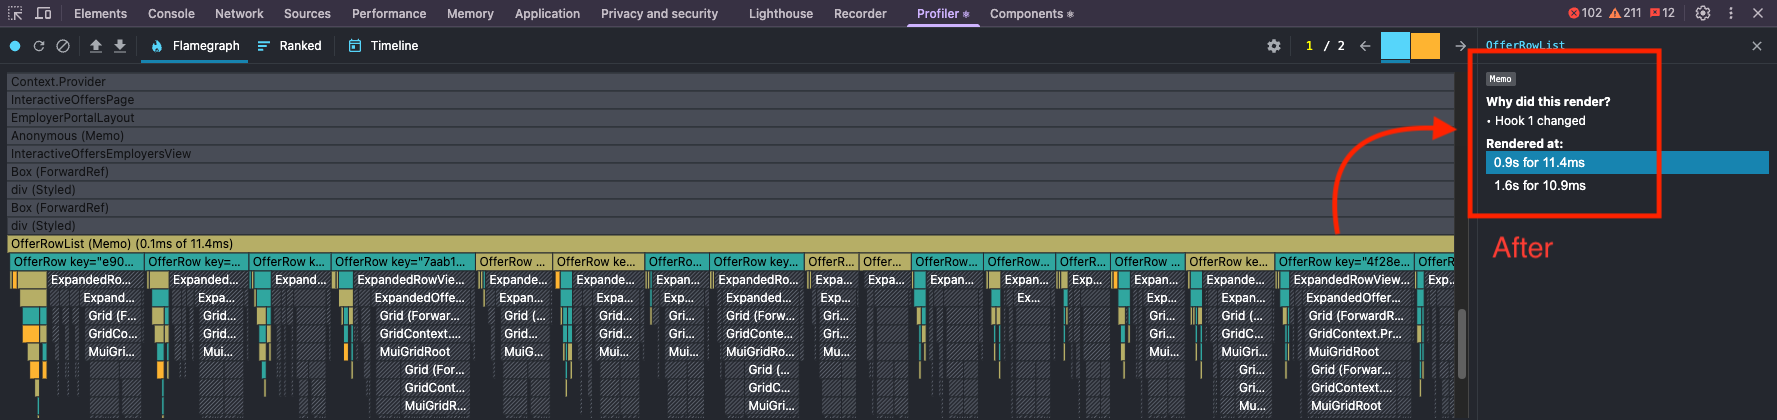
Flame chart before the optimizations
💡 Above is a flame chart generated by React Profiler. It logs the component render times as you interact with the UI.
In this case, toggling the accordion in our employers table, a pretty basic interaction, was taking around 60ms. That's much too high.
Here's a visual of what was going on:

So what went wrong?
We had a useState in the parent component tracking the open/closed state of the accordion. This caused every child component to re-render, even ones that didn't need to.
The fix? Relatively straightforward:
- Split the large component into smaller, independent ones
- Move the state down to the child component
- Since React data flows top-down, we kept the parent clean
- Memoize all functions and objects using
useCallbackanduseMemo
After that little spring cleaning...
Much better. 😌
Case 2: The Unnecessary Re-render
Even after optimizing the dashboard, toggling the Settings modal was causing unnecessary re-renders of sibling components.
The issue?
The modal lived inside the top-most component. So every toggle triggered a re-render of everything beneath it.
The fix:
Wrap the child component in React.memo. Since the modal toggle didn't affect its props, it had no reason to re-render.
And just like that, fixed.
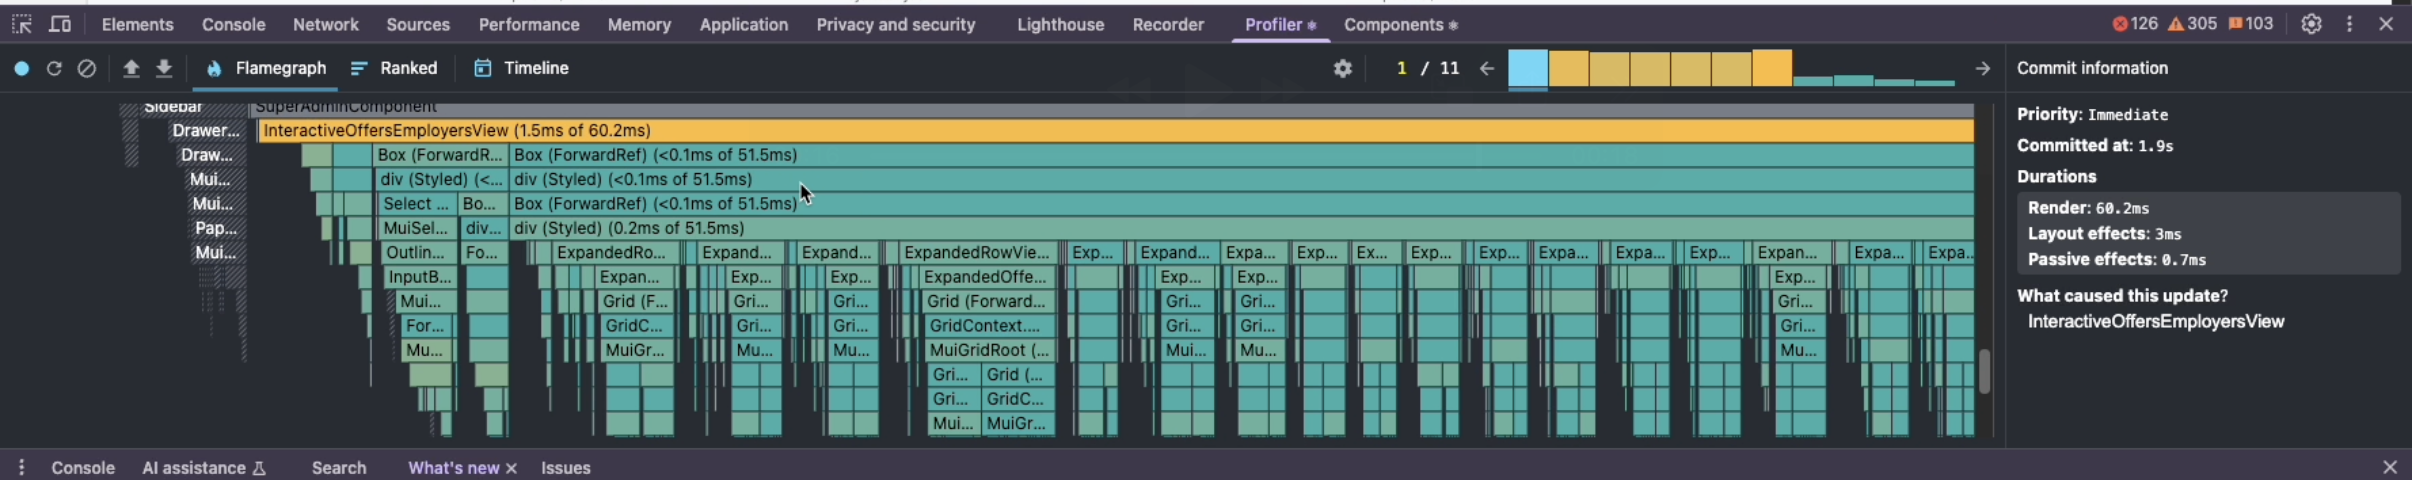
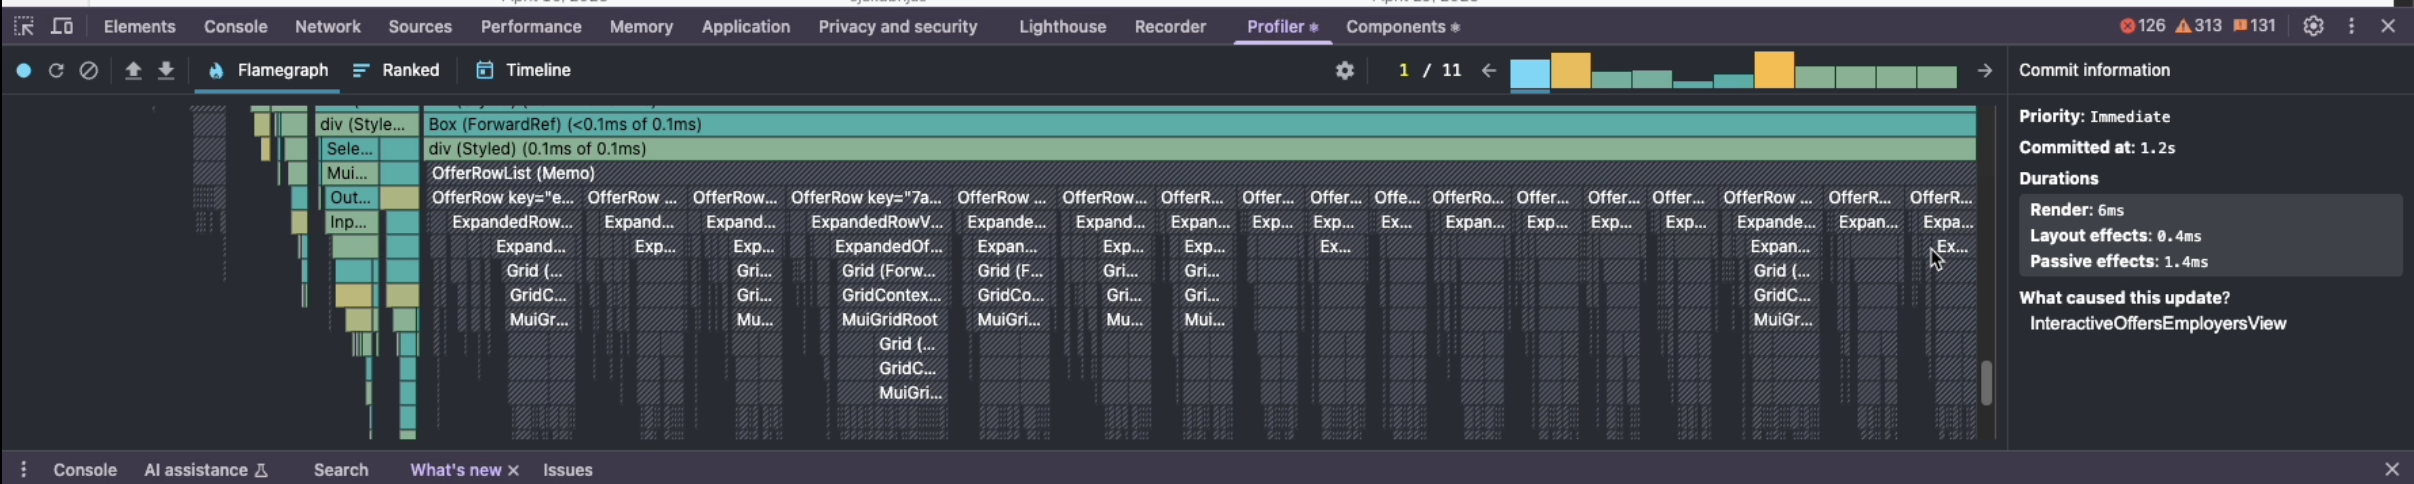
Let's check the flame chart after the optimizations.
Flame chart after the optimizations, when opening and closing an accordion
From 60ms to 11ms, that's a 5.5x improvement!
And the settings modal? That one fix alone gave us a 10x boost in performance.
That's a big win in my book.
Before Optimizations:
After Optimizations:
We made a few other tweaks in different parts of the app too. But if I included all of them, this blog post would turn into a full-blown React performance textbook.

Final Thoughts
Well jokes apart, these small things create a big difference in the long run. We could have easily ignored it, but taking some time out to fix the existing flow always pays off well (no pun intended).
According to web performance standards, 100ms is the threshold for something to feel instant. These improvements may not be flashy to the eye, but they absolutely improve the experience, and I learned a ton along the way.
Also... confession:
The slow, messy code before optimization? Yeah, I wrote that. But it's fixed now, so we're cool 😅
Happy coding and happy optimizing. See ya! ✨